Allows you to select from the values shown in the pull-down menu for each column. You can use this filter for the columns with
| A-E | F-J | K-O | P-T | U-Z |
Allows you to select from the values shown in the pull-down menu for each column. You can use this filter for the columns withmark of the Summary pane of a decode or stream view.
The buffer keeping capture data. Capture buffer is allocated on the memory of the host which ASTEC Eyes or Remote Module is installed. You can configure the capture buffer size and the action when the capture buffer is full.
The data captured or continuously captured for a longer period.
Displays the period the continuously captured data exists on the Log window.Capture data manager
Decodes a part of a capture file, or merges and decodes multiple capture files. You can specify the decode range by period or header attribute filter.Capture filter
The filter to collects only the packets of your interest. Configure logical expressions using filter editor.Common toolbar
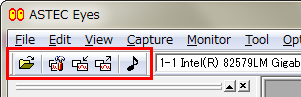
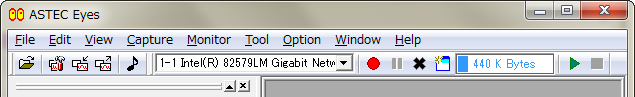
The toolbar of the Main window. There are buttons for the operations independent of selected interface, such as opening a capture file, saving and loading configuration, and so on. User can customize buttons on the toolbar.
It is required in order to change the configuration of an interface or host, such as writing log, writing continuous capture, changing interface label, and so on. Refer to Obtaining and Releasing the Privileges.
Captures packets continuously and save the captured data directly into files. Refer here for the operation.
Allows the user to screen packets or records easily by GUI operations in a decode and stream view.
There are three kinds of convenience filters:
Associates TCP/UDP port to a protocol. It is also possible to associate port number with a specific IP address to a protocol. For example, when a proxy server uses the port other than well-known port, configure decode hints with this information.
Allows you to screen packets in the decode view based upon the contents of Packet Detail pane.
Shows the decoded result of capture data or capture file.
Allows you to screen packets or records in a decode view or stream view. Use the filter editor to configure a display filter.
The Dump pane shows the hexadecimal dump of the packet or record content in a decode view or stream view. It is the bottom area of a decode or stream view.
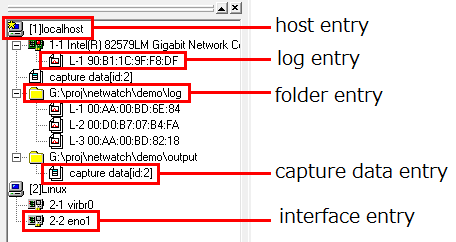
Means the icon and label of the host, interface, log, capture data, and directory of the log or capture data displayed in the Interface Selector window.
A filter created by the filter editor. It is used to specify the conditions of user defined event and monitor event.
There are two types of expert events in ASTEC Eyes; monitor expert events and decode expert events.F-J
Monitor expert events detect the symptoms of network trouble while monitoring, and display them. You can configure the event to be detected.
Decode expert events detect the symptoms of network trouble while decoding the capture data, and display them. You can configure the event to be detected.
Defines the logical expressions for the filters of display filter , monitor filter , capture filter , start capture trigger , pause capture trigger , continuous capture filter , start continuous capture trigger , pause continuous capture trigger .Graph Item
The elements displayed in a chart, such as line, bar, and pie. A Graph Item may be a host, host pair, protocol and so on.Grip handle and drag bar
They are the components placed in the top or left side of the docking toolbar and window. Right-clicking on the grip handle or drag bar makes the toolbar and window shown or hidden. Dragging the grip handle or drag bar moves the toolbar or window.
Allows you to screen packets in the decode view based upon the values in packet headers.
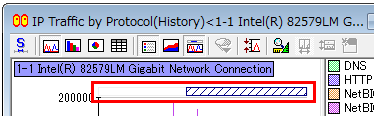
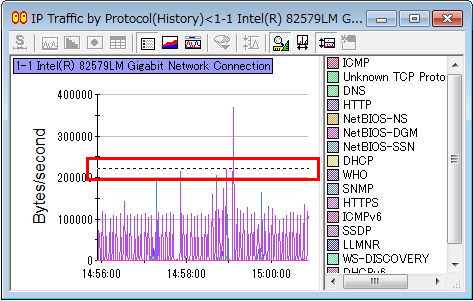
It is used to read the value of a chart. This cursor is appeared when you click [Horizontal Hair Cursor] button (Interface) in the chart analysis mode of the Traffic window. It is shown as dashed line.
Same as a network interface.
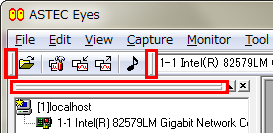
The window used for the operations about interfaces such as selecting an interface, connecting to the Remote Module, and so on.
The toolbar of the Main window. There are buttons for the operation of the selected interface, such as starting or pausing monitoring, starting or pausing capturing, and so on. You can customize buttons on the toolbar.K-O
Periodically outputs statistics of network traffic and monitor events except for TCP Status Information into a file. The data saved into a file is called log, and the files saved is called log files. The following 17 kinds of data are saved as log;
Refer here for the operation about a log.
- MAC Traffic
- MAC Traffic by Source
- MAC Traffic by Destination
- MAC Traffic by Host Pair
- MAC Traffic by Protocol
- IP Traffic
- IP Traffic by Source
- IP Traffic by Destination
- IP Traffic by Host Pair
- IP Traffic by Protocol
- MAC Traffic by Address Type
- MAC Frame Numbers by Frame Size
- MAC Error Frames
- MAC Address Table
- IP Address Table
- MAC - IP Address Table
- Event
Displays important messages from ASTEC Eyes. For example, it displays the value read using the Chart Analysis function , the frame ID, stream ID and protocol name of packets or records that ASTEC Eyes could not decode.
It is the information collected while monitoring, such as the traffic statistics displayed on a Monitor window, IP addresses, MAC addresses, TCP connection information, and so on.
Selects the traffic to be displayed on a Monitor window. The filter conditions are configured using the filter editor.
Displays the data (traffic statistics, MAC addresses, IP addresses, connection status of TCP) collected while monitoring in a chart or table format. There are 17 kinds of Monitor windows shown below. Monitor window is classified into three kinds, a Traffic window , an address table, and TCP status information.
- MAC Traffic
- MAC Traffic by Source
- MAC Traffic by Destination
- MAC Traffic by Host Pair
- MAC Traffic by Protocol
- IP Traffic
- IP Traffic by Source
- IP Traffic by Destination
- IP Traffic by Host Pair
- IP Traffic by Protocol
- MAC Traffic by Address Type
- MAC Frame Numbers by Frame Size/LI>
- MAC Error Frames
- MAC Address Table
- IP Address Table
- MAC - IP Address Table
- TCP Status Information
It is a Network Interface Card (NIC) installed on a host. If multiple network interface cards are installed in one host, you need to select the target network interface before monitoring or capturing.P-T
It is a filter to pause capture when a packet with specific features is found. Use the filter editor to configure a pause capture trigger.
Pause continuous capture trigger
Pauses continuous capture when a packet with specific features is found. The filter conditions are configured using the filter editor.
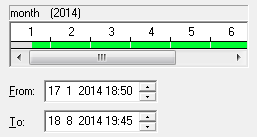
It is used to specify the period range in the [Displaying Log] dialog box, [Capture Data Manager] dialog box, and [Continuous Capture] dialog box. You can specify the start and end time of the period by mouse operation.realtime decode capture
Captures packets and shows their summary information in realtime decode view simultaneously.realtime decode view
Shows the summary information of caputed packets in realtime. You can view the detailed analysis of each packet by displaying decode view from realtime decode view.Refresh interval
It is the interval between updating chart or table in the Traffic window.
Has the same functionalities of collecting data as these of ASTEC Eyes Basic Package. Remote Modules can be connected from multiple ASTEC Eyes and send the collected data.
You can monitor a remote network as you monitor the local network, through the Remote Module installed on a remote host.
Shows the analysis of the packet or record in the decode view or stream view. It shows protocol fields and their values. It is the center area of decode or stream view.
The documents which define the technical know-how, specification, standard process, and so on about Internet. IETF (Internet Engineering Task Force), the organization defining the Internet technology standards, publishes and manages the documents. You can view these documents in the "Unsupported" directory of the ASTEC Eyes installation CD.
Displays TCP and UDP ports status of the host shown in a Traffic window or address book. It shows the succeeded connection count, refused count, and timeout count.
It is the target cell for the operation in the Monitor window of the table format, Summary pane of a decode or stream view, Decode Hints page of [Option] dialog box, and so on. Selected cell is surrounded by a white frame.
Reassembles TCP stream and displays the decoded result by session.
Starts capture when a packet with specific features is found. Use the filter editor to configure a start capture trigger.
Start continuous capture trigger
Starts continuous capture when a packet with specific features is found. The filter conditions are configured using the filter editor.
Displays the status of ASTEC Eyes or Graph Item name selected in the Traffic window.
Reassembles TCP stream and displays the decoded result.
The pane to show the summary of packets or records in a decode view or stream view. It is the top area of decode or stream view.
TCP connection status displayed in a Monitor window.
The period of displaying the traffic statistics. There are three time spans; short, middle and long time span. You can choose one of these time spans. The intervals generating the traffic statistics differ for every time span; they are 1 second, 10 seconds, and 5 minutes, respectively.
Displays the statistical data of traffic, in line chart, bar chart, pie chart, and table format. There are thirteen kinds of Traffic window:U-Z
- MAC Traffic
- MAC Traffic by Source
- MAC Traffic by Destination
- MAC Traffic by Host Pair
- MAC Traffic by Protocol
- IP Traffic
- IP Traffic by Source
- IP Traffic by Destination
- IP Traffic by Host Pair
- IP Traffic by Protocol
- MAC Traffic by Address Type
- MAC Frame Numbers by Frame Size
- MAC Error Frames
An event detected when the conditions defined by user are met. The conditions for user defined event are specified in an event filter using filter editor.Vertical cursor
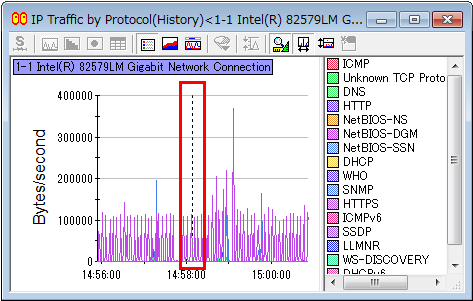
It is used to read the value of a chart. This cursor is appeared when you click [Vertical Hair Cursor] button (Voice quality information) in the chart analysis mode of the Traffic window. It is shown as dashed line.
Indicates voice quality. It includes R value, MOS value, round trip time, jitter, and packet loss rate.
The area to display windows, such as Monitor window, decode view, stream view, and so on, except for dialog boxes. You can use multiple workspaces for organizing windows in ASTEC Eyes.