
To view network traffic, you use monitoring.
You can view the traffic classified by the source addresses, the destination addresses, the host pairs, and the protocols. You can visualize the statistics of the traffic in chart and table formats.
- 1. Starting Monitoring
Select the network interface to be monitored before you start monitoring. To select the network interface, click on an interface icon or label in the Interface Selector window. Then click the Start Monitor button on the Interface toolbar to start monitoring.

- 2. Displaying Charts
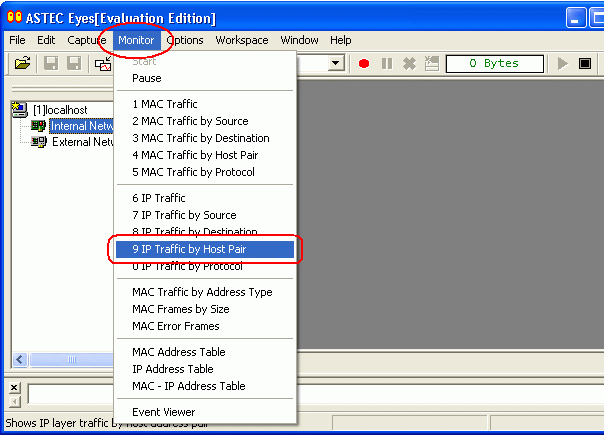
Choose the statistics type from Monitor menu in the menu bar. The Monitor window will appear. ASTEC Eyes provides Monitor windows for the following thirteen types of statistics.
- MAC Traffic
- Displays the total traffic measured in packets or bytes at the MAC (Media Access Control) layer.
- MAC Traffic by Source
- Displays the traffic classified by the source addresses at the MAC layer.
- MAC Traffic by Destination
- Displays the traffic classified by the destination addresses at the MAC layer.
- MAC Traffic by Host Pair
- Displays the traffic classified by the combinations of the source and the destination addresses (the host pairs) at the MAC layer.
- MAC Traffic by Protocol
- Displays the traffic classified by the protocols at the MAC layer.
- IP Traffic
- Displays the total traffic measured at the IP (Internet Protocol) layer.
- IP Traffic by Source
- Displays the traffic classified by the source addresses at the IP layer.
- IP Traffic by Destination
- Displays the traffic classified by the destination addresses at the IP layer.
- IP Traffic by Host Pair
- Displays the traffic classified by the combinations of the source and the destination addresses (the host pairs) at the IP layer.
- IP Traffic by Protocol
- Displays the traffic classified by the protocols at the IP layer.
- MAC Traffic by Address Type
- Displays the traffic classified by the address types (unicast, multi-cast, or broadcast) at the MAC layer.
- MAC Frames by Size
- Displays the traffic classified by the frame size ranges at the MAC layer.
- MAC Error Frames
- Displays the statistical data of error packets. The data is classified by the types of errors.
- 3. Changing the Display Format of the Monitor Window
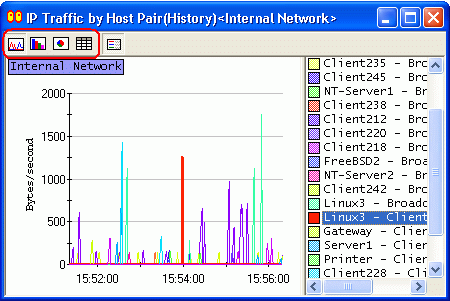
The monitor window displays the statistics of the traffic in line chart, bar chart, pie chart, and detailed table formats (The bar chart and pie chart for "MAC Traffic" and "IP Traffic" are not available). To change the display format, click the appropriate button in the toolbar of each Monitor window.
- 4. Viewing the Traffic Breakdown
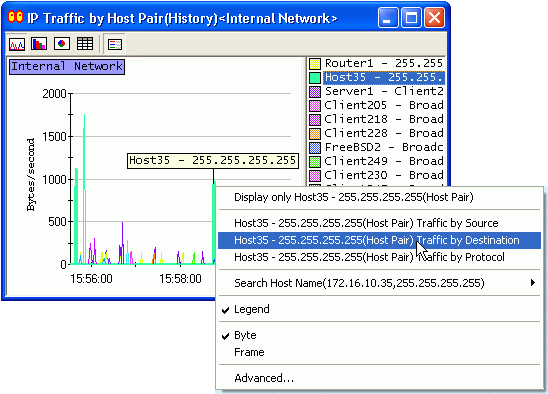
With ASTEC Eyes, you can investigate the breakdown of the traffic to know which host pairs are involved in the specific protocol traffic, or what protocols are used for the specific host pair traffic.
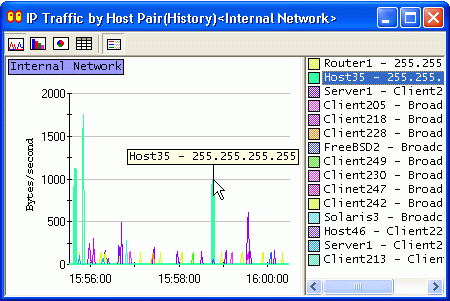
To display the further breakdown, first select a host or a protocol in the Monitor window by clicking on the corresponding chart item or legend. Then, click on the Monitor window with the right mouse button, and a popup menu will appear. Choose the menu item for the type of breakdown you want to know.
To do this, first you need to copy the packets flowing through the network into the buffer of ASTEC Eyes. This operation is called capture. The buffer packets are copied into is called the capture buffer.
Second, you need to analyze the captured data according to the protocol specifications and show its results. This operation is called decoding packets.
- 1. Starting Capturing
Select the network interface before you start capturing. To select the network interface, click on an interface icon or label in the Interface Selector window. Then click the Start Capture button on the Interface toolbar to start capturing.
The Capture Buffer Meter on the Interface toolbar shows the number of bytes copied into the capture buffer.

- 2. Pausing Capturing
After copying some packets, click the Pause Capture button on the Interface toolbar to pause capturing.

- 3. Decoding Captured Data
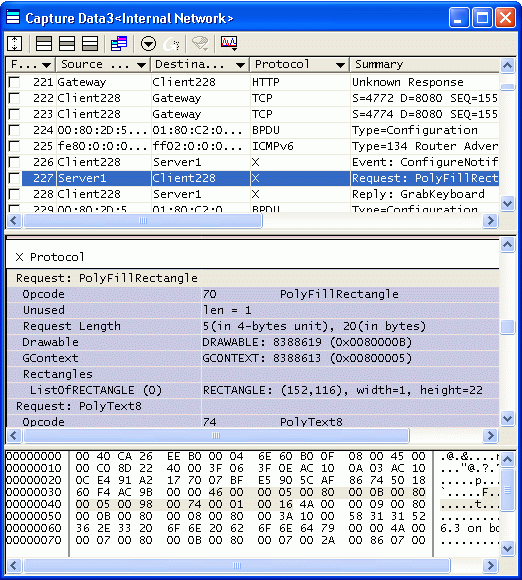
Click the New Decode View button on the Interface toolbar. The data in the capture buffer will be decoded, and the Decode View will appear showing the result.

The Decode view is divided into three panes: the Summary pane, the Packet Detail pane, and the Dump pane. In the Summary pane, the summaries of the packets are shown. In the Packet Detail pane, the detailed analysis of each packet is displayed. In the Dump pane, the packet data are shown in a hexadecimal format. Each row in the Summary pane corresponds to a packet.
- 4. Screening Data to Be Displayed
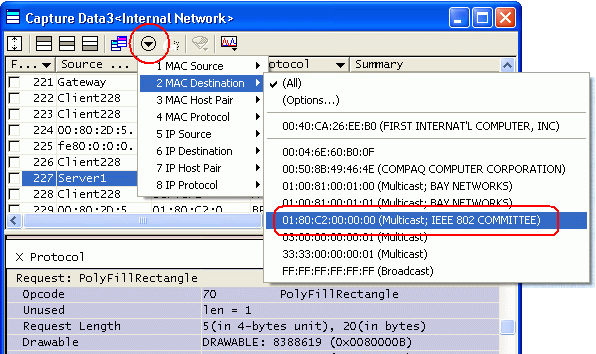
- Typically many packets are displayed in the Decode view. ASTEC Eyes provides caption filter, header attribute filter, and so forth to narrow the packets being displayed so that you can easily reach the packets of interest.
- 5. Using the Stream View
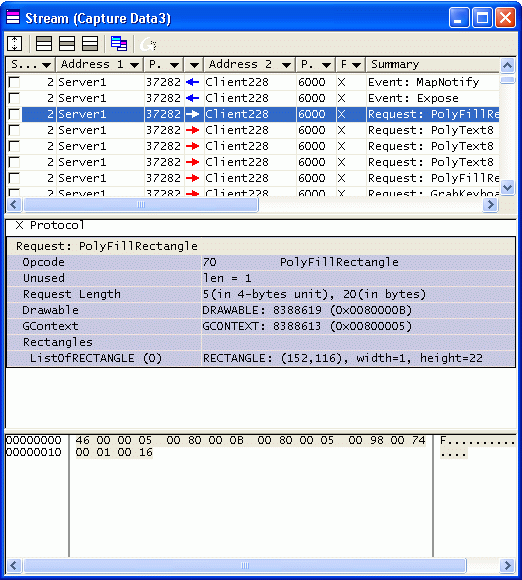
Click the Stream View button on the toolbar of the Decode view. The Stream view will appear.

The Stream view reassembles the virtual TCP streams from the captured data, and then decodes and visualizes the application layer packets. It is particularly effective for those protocols whose application layer packets can be fragmented over several TCP packets.

|
[HOME] |